
How to Automate PDF Reports from Google Sheets – No-Code Guide (Make.com + APITemplate)
 By Aditya Trivedi
Use a PDF generation API to automate reports from Google Sheets with Make.com. Step-by-step guide with templates and no-code setup.
TL;DR
This guide walks you through automating PDF report generation from Google Sheets using Make.com (a no-code automation platform) and APITemplate (a PDF generation API). Here’s what you need to know:
- What you’ll build: An automation that watches your Google Sheet, pulls new data, generates a professionally formatted PDF, and saves it to Google Drive (or emails it directly).
- Time required: About 30-45 minutes for initial setup.
- Cost: Free tiers available for all three tools. You can generate up to 50 PDFs/month on the free plan.
- Technical skill needed: None. This is a completely no-code solution.
- Best for: Sales reports, client summaries, invoices, project updates, inventory reports, and any recurring document you currently create manually from spreadsheet data.
Key takeaway: If you spend more than 10 minutes each week copying data from a spreadsheet into a report template, this automation will pay for itself immediately.
1. Why Use a PDF API for Google Sheets?
Most businesses run on spreadsheets. Sales numbers, project timelines, inventory counts, expense logs-it all lives in Google Sheets. However, the problem starts when you need to share that data with someone who doesn’t want to stare at rows and columns.
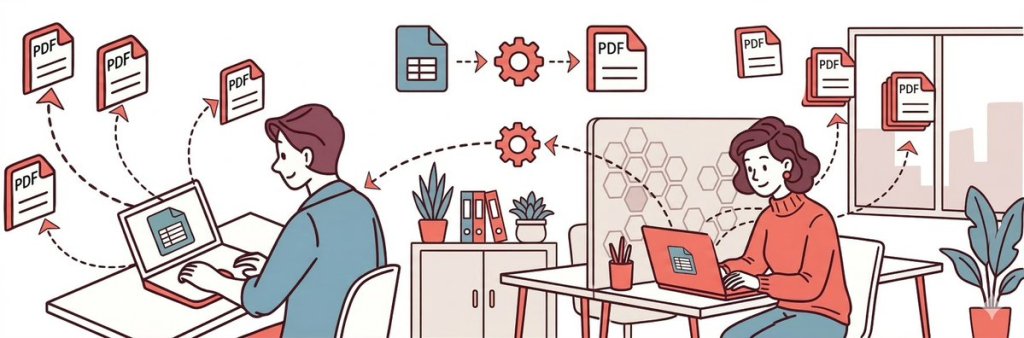
Clients want polished reports. Executives want dashboards. Partners want summaries. Many businesses are turning to automated report generation to create and deliver these reports without manual effort. Consequently, what do you do? You copy data from the spreadsheet, paste it into a Word doc or Google Doc, format it to look decent, export it as a PDF, and send it off. Then you do it again next week. And the week after that.
This manual process creates three problems:
First, it wastes time. A report that should take 2 minutes to generate ends up taking 60 minutes because of all the copying, formatting, and exporting. Multiply that by the number of reports you create each month, and you’re looking at hours of lost productivity.
Second, it introduces errors. Every time you manually copy data, there’s a chance you’ll grab the wrong cell, miss a row, or paste outdated numbers. I’ve seen companies send reports with last month’s figures more times than I can count. Document automation statistics also suggest that manual data handling is responsible for a significant portion of reporting errors, while automation can cut these errors by more than 50%.
Third, it doesn’t scale. One weekly report is manageable. However, ten weekly reports for ten different clients? That becomes a part-time job.
Fortunately, automation solves all three problems. When your spreadsheet updates, your PDF generates itself. As a result, the data is always current, the formatting is always consistent, and you don’t lift a finger.
What does “automated PDF generation” actually mean?
Automated PDF generation is the process of creating PDF documents programmatically based on data from another source-in this case, Google Sheets. Instead of manually formatting documents, you set up a system that:
- Checks your spreadsheet at scheduled intervals for new data
- Pulls that data when found
- Inserts it into a pre-designed template
- Renders a PDF file
- Delivers it wherever you need it (email, cloud storage, Slack, etc.)
The entire process happens without human intervention. In other words, you set it up once, and it runs indefinitely.
2. Best Reports for PDF Generation API Automation
Not every document benefits from automation. However, if you’re creating the same type of document repeatedly with different data, automation is a game-changer.
Ideal report types for automation:
- Sales Reports: Weekly performance summaries, revenue breakdowns, team leaderboards
- Client Reports: Project progress updates, budget tracking, milestone summaries
- Financial Documents: Expense reports, invoices, budget variance reports
- Operations: Inventory alerts, fulfillment reports, receiving logs
- HR Documents: Attendance summaries, certification reports, performance reviews
What Makes a Report Good for Automation?
Ask yourself: Do you create this report repeatedly? Does the format stay the same with only data changing? If yes, automation makes sense.
3. The Stack: Google Sheets, Make.com, and PDF Generation API
Google Sheets: Your Data Source
Google Sheets provides real-time collaboration, API access, and trigger capabilities for automated workflows.
Make.com: The Automation Engine
Make.com is a no-code automation platform with visual workflow builder, 1,500+ app integrations, conditional logic, and a free tier (1,000 ops/month).
APITemplate: The PDF Generation API Service
is a cloud-based PDF API that converts HTML templates into PDF documents. Key features:
- HTML/CSS templates with Jinja2 syntax (
{{ variable }}) - Direct Make.com integration
- Fast rendering (1-3 seconds)
- Free tier: 50 PDFs/month
How These Tools Connect
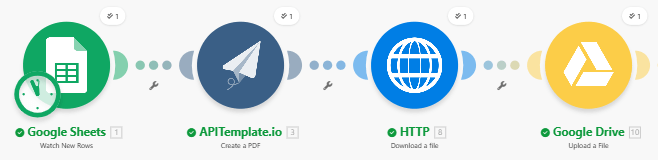
Specifically, here’s the data flow in plain terms:
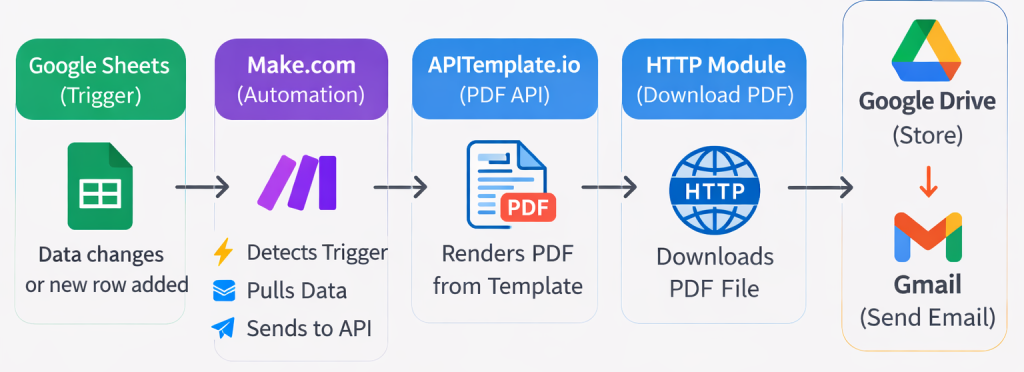
- Google Sheets triggers the workflow when data changes
- Make.com pulls data and sends it to the PDF tool
- APITemplate renders the PDF and returns a download URL
- HTTP module downloads the PDF file
- Google Drive (or Gmail) stores/delivers the PDF
The beauty of this setup is that each tool does one thing well. Google Sheets manages data. Make.com handles automation logic. APITemplate renders PDFs. You don’t need to compromise on any part of the workflow.
4. How PDF API Automation Works
Let me walk through a concrete example so you can visualize the entire process.
PDF API Scenario: Weekly Sales Performance Report
Imagine you’re a sales manager. Every Friday, you need to send each salesperson a PDF summarizing their weekly performance. The data lives in a Google Sheet that looks like this:
| report_date | salesperson_name | region | deals_closed | target_deals | revenue | target_revenue | status | |
|---|---|---|---|---|---|---|---|---|
| 2025-03-07 | Sarah Sharma | Northeast | 12 | 10 | 48500 | 40000 | Exceeded | sarah@company.com |
| 2025-03-07 | Marcus Tiwari | Southwest | 8 | 10 | 36200 | 40000 | Below | marcus@company.com |
| 2025-03-07 | Aditya Trivedi | Midwest | 10 | 10 | 41000 | 40000 | On Target | adityatrivedi08082001@gmail.com |
The automation flow:
- Trigger: Make.com detects new rows in your Google Sheet
- Extract: Pulls data from the row (name, region, revenue, etc.)
- Generate: Sends data to PDF generation API with your template ID
- Render: The PDF is generated in 1–2 seconds.
- Deliver: HTTP module downloads PDF, saves to Google Drive or emails it
Total time: ~10-15 seconds for multiple reports vs. 60+ minutes manually.
Available Triggers
| Trigger Type | Best For |
|---|---|
| Watch Rows | Real-time processing (order confirmations, form submissions) |
| Schedule | Regular reports (weekly summaries, monthly statements) |
5. Prerequisites for Setup
Before you start building, first make sure you have the following:
Account Checklist
| Service | What You Need | Free Tier? |
|---|---|---|
| Google Account | For Google Sheets and Drive access | Yes |
| Make.com | For automation workflows | Yes (1,000 ops/month) |
| APITemplate | For PDF generation | Yes (50 PDFs/month) |
Prepare Your Google Sheet
Create a Google Sheet with clear column headers (e.g., salesperson_name, region, revenue, email). These headers map directly to your PDF template variables.
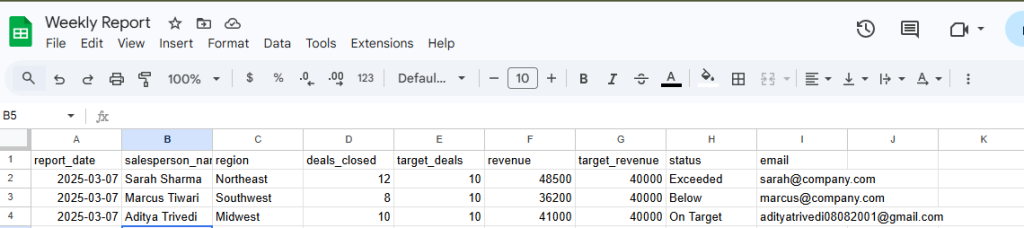
Your Google Sheet showing sample data.
Get Your API Keys
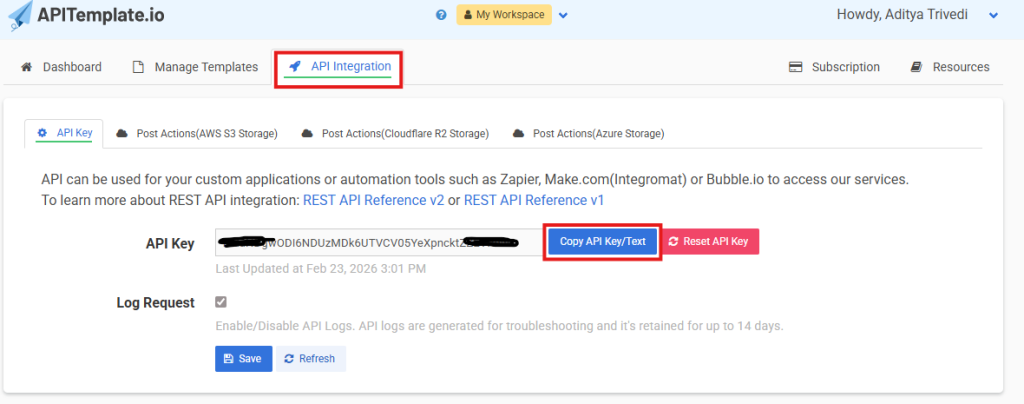
- APITemplate.io: Go to apitemplate.io -> API Integration -> Copy your API key
Copy your API key from the API Integration page. Keep this secure-it authenticates all your PDF requests.
2. Make.com: Create account at make.com and verify email
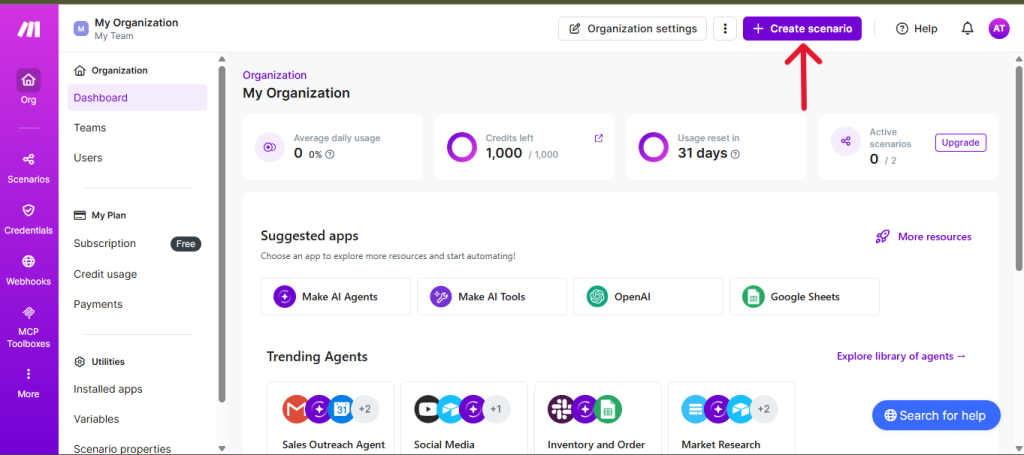
The Make.com dashboard is where you’ll build your automation. Click ‘Create a new scenario’ to get started.
6. Creating Your PDF Generation API Template
It uses HTML/CSS templates with Jinja2 syntax for dynamic content.
Step 6.1: Create a New Template
- Log in to APITemplate -> Manage Templates -> New PDF template
- Name it (e.g., “Weekly Sales Report”) -> Click Create
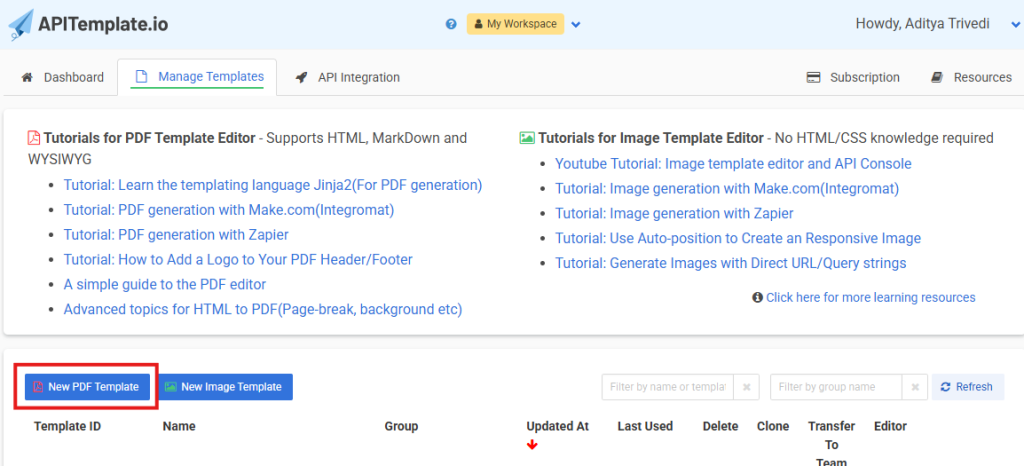
Go to the manage templates tab and click on “New PDF Template”
Step 6.2: Design the Template with HTML and CSS
Click the HTML/Template tab and paste your HTML code. Here’s a simplified example:
<!DOCTYPE html>
<html>
<head>
  <meta charset="UTF-8">
  <title>Sales Report - {{ salesperson_name }}</title>
  <style>
    /* Reset and base styles */
    * {
      margin: 0;
      padding: 0;
      box-sizing: border-box;
    }

    body {
      font-family: 'Segoe UI', Tahoma, Geneva, Verdana, sans-serif;
      line-height: 1.6;
      color: #2d3748;
      padding: 40px;
      background: #ffffff;
    }

    /* Header section */
    .report-header {
      text-align: center;
      padding-bottom: 25px;
      border-bottom: 3px solid #3182ce;
      margin-bottom: 30px;
    }

    .report-header h1 {
      font-size: 26px;
      color: #1a365d;
      margin-bottom: 8px;
      font-weight: 600;
    }

    .report-header .subtitle {
      font-size: 14px;
      color: #718096;
    }

    /* Info cards row */
    .info-cards {
      display: flex;
      justify-content: space-between;
      gap: 20px;
      margin-bottom: 30px;
    }

    .info-card {
      flex: 1;
      background: #f7fafc;
      border-radius: 8px;
      padding: 20px;
      text-align: center;
      border: 1px solid #e2e8f0;
    }

    .info-card .label {
      font-size: 11px;
      text-transform: uppercase;
      letter-spacing: 0.5px;
      color: #718096;
      margin-bottom: 5px;
    }

    .info-card .value {
      font-size: 18px;
      font-weight: 600;
      color: #2d3748;
    }

    /* Section titles */
    .section-title {
      font-size: 16px;
      font-weight: 600;
      color: #1a365d;
      margin: 30px 0 15px 0;
      padding-bottom: 8px;
      border-bottom: 2px solid #e2e8f0;
    }

    /* Data table */
    .data-table {
      width: 100%;
      border-collapse: collapse;
      margin-bottom: 25px;
      font-size: 14px;
    }

    .data-table th {
      background: #2b6cb0;
      color: #ffffff;
      padding: 12px 15px;
      text-align: left;
      font-weight: 500;
      font-size: 12px;
      text-transform: uppercase;
      letter-spacing: 0.5px;
    }

    .data-table td {
      padding: 12px 15px;
      border-bottom: 1px solid #e2e8f0;
    }

    .data-table tr:nth-child(even) {
      background: #f7fafc;
    }

    .data-table tr:hover {
      background: #edf2f7;
    }

    /* Status badges */
    .status-badge {
      display: inline-block;
      padding: 4px 12px;
      border-radius: 20px;
      font-size: 11px;
      font-weight: 600;
      text-transform: uppercase;
    }

    .status-exceeded {
      background: #c6f6d5;
      color: #22543d;
    }

    .status-on-target {
      background: #bee3f8;
      color: #2a4365;
    }

    .status-below {
      background: #fed7d7;
      color: #742a2a;
    }

    /* Summary box */
    .summary-box {
      background: linear-gradient(135deg, #2b6cb0 0%, #4299e1 100%);
      color: #ffffff;
      padding: 25px;
      border-radius: 10px;
      margin-top: 30px;
    }

    .summary-box h3 {
      font-size: 14px;
      font-weight: 500;
      margin-bottom: 20px;
      opacity: 0.9;
    }

    .summary-stats {
      display: flex;
      justify-content: space-around;
      text-align: center;
    }

    .summary-stat .number {
      font-size: 28px;
      font-weight: 700;
    }

    .summary-stat .label {
      font-size: 11px;
      opacity: 0.85;
      margin-top: 5px;
    }

    /* Footer */
    .footer {
      margin-top: 40px;
      padding-top: 20px;
      border-top: 1px solid #e2e8f0;
      text-align: center;
      font-size: 11px;
      color: #a0aec0;
    }
  </style>
</head>
<body>
  <!-- Report Header -->
  <div class="report-header">
    <h1>Weekly Sales Performance Report</h1>
    <p class="subtitle">{{ region }} Region • Week Ending {{ report_date }}</p>
  </div>

  <!-- Quick Info Cards -->
  <div class="info-cards">
    <div class="info-card">
      <div class="label">Salesperson</div>
      <div class="value">{{ salesperson_name }}</div>
    </div>
    <div class="info-card">
      <div class="label">Region</div>
      <div class="value">{{ region }}</div>
    </div>
    <div class="info-card">
      <div class="label">Report Period</div>
      <div class="value">{{ report_date }}</div>
    </div>
  </div>

  <!-- Performance Summary Section -->
  <h2 class="section-title">Performance Summary</h2>

  <table class="data-table">
    <thead>
      <tr>
        <th>Metric</th>
        <th>Actual</th>
        <th>Target</th>
        <th>Variance</th>
        <th>Status</th>
      </tr>
    </thead>
    <tbody>
      <tr>
        <td><strong>Deals Closed</strong></td>
        <td>{{ deals_closed }}</td>
        <td>{{ target_deals }}</td>
        <td>
          {% if deals_closed|int >= target_deals|int %}
            <span style="color: #22543d;">+{{ deals_closed|int - target_deals|int }}</span>
          {% else %}
            <span style="color: #742a2a;">{{ deals_closed|int - target_deals|int }}</span>
          {% endif %}
        </td>
        <td>
          {% if status == 'Exceeded' %}
            <span class="status-badge status-exceeded">Exceeded</span>
          {% elif status == 'On Target' %}
            <span class="status-badge status-on-target">On Target</span>
          {% else %}
            <span class="status-badge status-below">Below Target</span>
          {% endif %}
        </td>
      </tr>
      <tr>
        <td><strong>Revenue Generated</strong></td>
        <td>${{ "{:,}".format(revenue|int) }}</td>
        <td>${{ "{:,}".format(target_revenue|int) }}</td>
        <td>
          {% if revenue|int >= target_revenue|int %}
            <span style="color: #22543d;">+${{ "{:,}".format(revenue|int - target_revenue|int) }}</span>
          {% else %}
            <span style="color: #742a2a;">-${{ "{:,}".format(target_revenue|int - revenue|int) }}</span>
          {% endif %}
        </td>
        <td>
          {% if revenue|int >= target_revenue|int %}
            <span class="status-badge status-exceeded">Exceeded</span>
          {% else %}
            <span class="status-badge status-below">Below Target</span>
          {% endif %}
        </td>
      </tr>
    </tbody>
  </table>

  <!-- Achievement Summary -->
  <div class="summary-box">
    <h3>Period Achievement Summary</h3>
    <div class="summary-stats">
      <div class="summary-stat">
        <div class="number">{{ deals_closed }}</div>
        <div class="label">Deals Closed</div>
      </div>
      <div class="summary-stat">
        <div class="number">${{ "{:,}".format(revenue|int) }}</div>
        <div class="label">Total Revenue</div>
      </div>
      <div class="summary-stat">
        <div class="number">{{ ((revenue|int / target_revenue|int) * 100) | round }}%</div>
        <div class="label">Target Achievement</div>
      </div>
    </div>
  </div>

  <!-- Footer -->
  <div class="footer">
    Generated automatically on {{ generation_date }} - Powered by APITemplate.io
  </div>
</body>
</html>
Step 6.3: Jinja2 Template Syntax
| Syntax | Purpose |
|---|---|
{{ variable }} | Insert a value |
{{ "{:,}".format(value|int) }} | Format numbers with commas |
{% if condition %} | Conditional logic |
Step 6.4: Preview and Test the Template
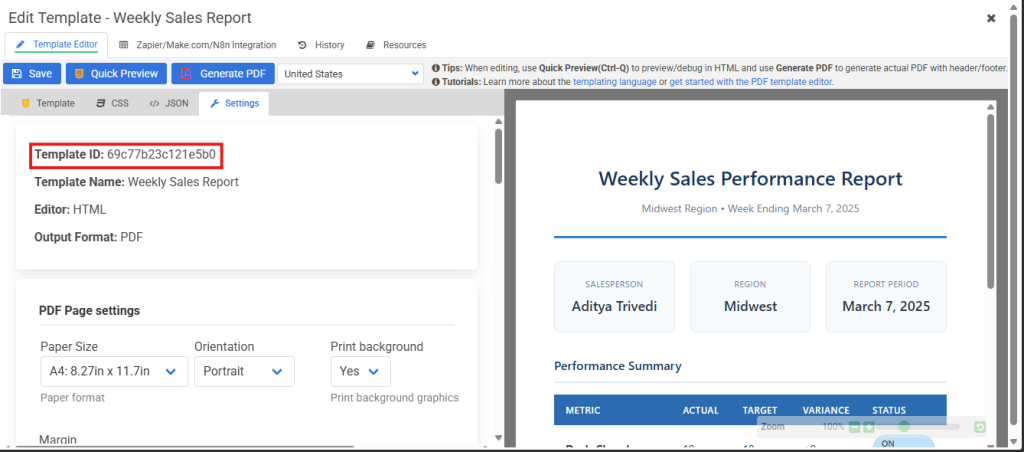
- Click Data tab -> Enter test JSON -> Click Preview
The preview shows exactly how your PDF will look. Check that all variables populate correctly before moving on.
2. Click Save -> Note your Template ID from the Settings tab
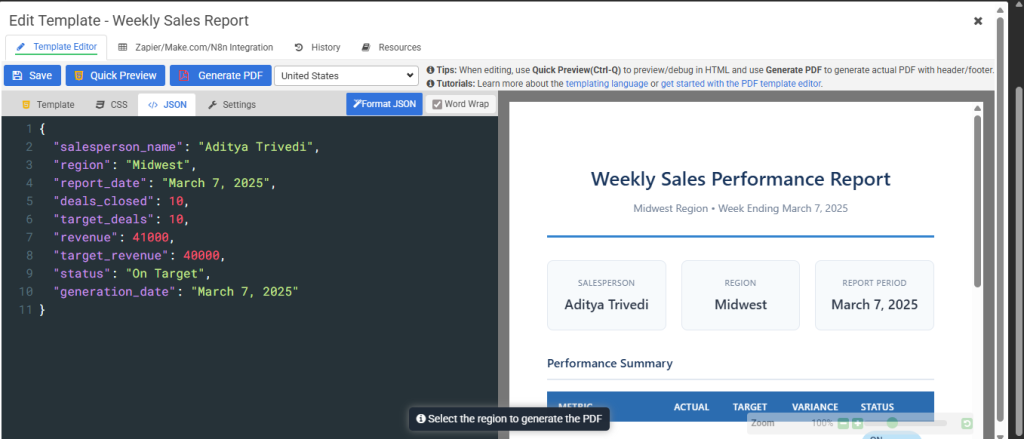
Copy your template ID from the URL or Settings tab. You’ll paste this into Make.com in the next section.
7. Building the PDF API Automation
Now that your template is ready, it’s time to connect everything in Make.com. This section walks you through building the complete workflow.
Step 7.1: Create a New Scenario
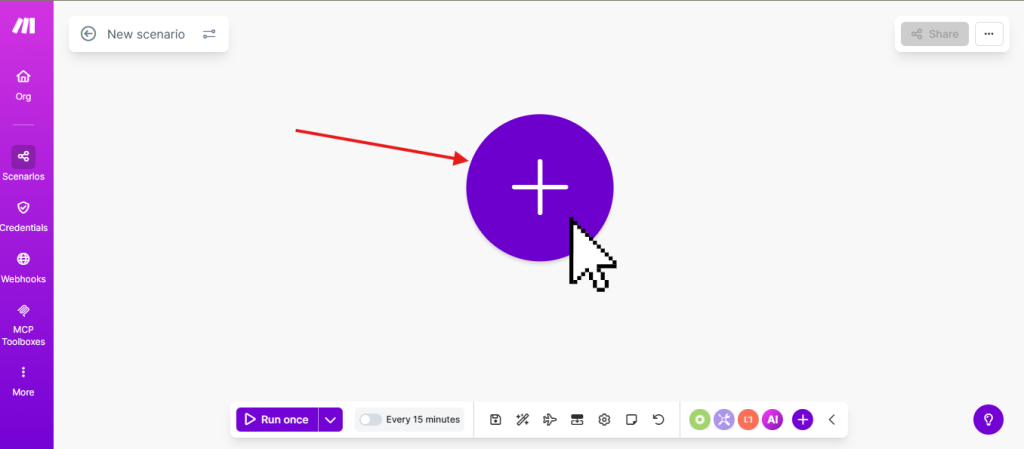
Log in to Make.com → Click Create a new scenario
The scenario canvas is where you’ll build your automation. Click on the circle+ to create a module.
Step 7.2: Add the Google Sheets Trigger
- Click the empty circle -> Search “Google Sheets” -> Select Watch Rows
- Connect your Google account and configure:
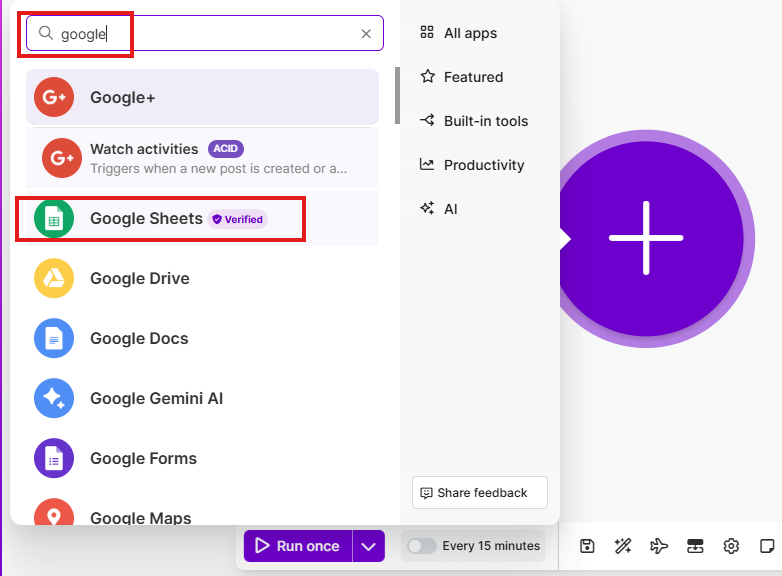
Search for ‘Google Sheets’ and select it to add the trigger module.
- Click Add next to Connection to link your Google account
- Follow the OAuth prompts to authorize Make.com
Once connected, configure the trigger as follows:
| Field | Value |
|---|---|
| Connection | Your Google account |
| Search Method | Search by path |
| Drive | My Drive |
| Spreadsheet ID | Select your spreadsheet from the dropdown |
| Sheet Name | Select the specific sheet tab (e.g., Sheet1) |
| Table contains headers | Yes |
| Row with headers | A1:Z1 |
| Limit | 10 (or however many rows to process per run) |
- Click Save to save the module
Step 7.3: Add the Module
- Click + -> Search “APITemplate” -> Select Create a PDF
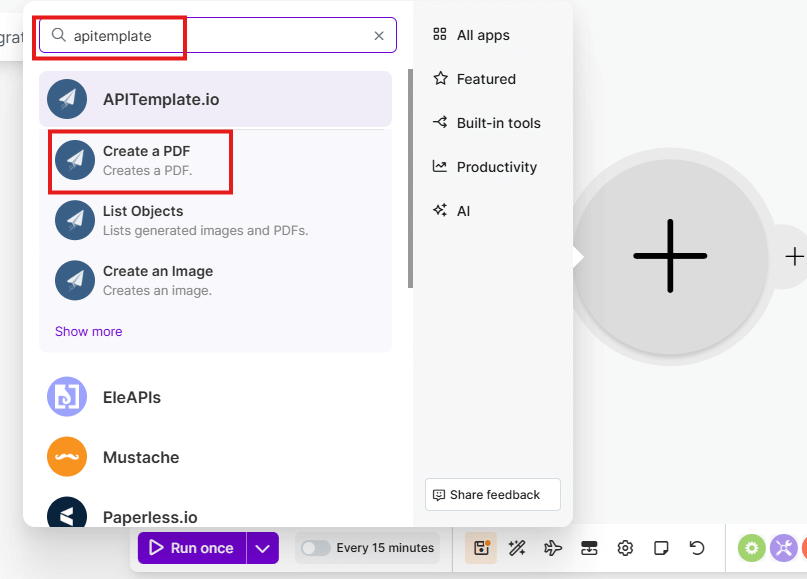
Click the plus icon to add another module, then search for APITemplate.
- Enter your API key and select Dynamic data (JSON Payload)
- Select your template from the Template ID dropdown
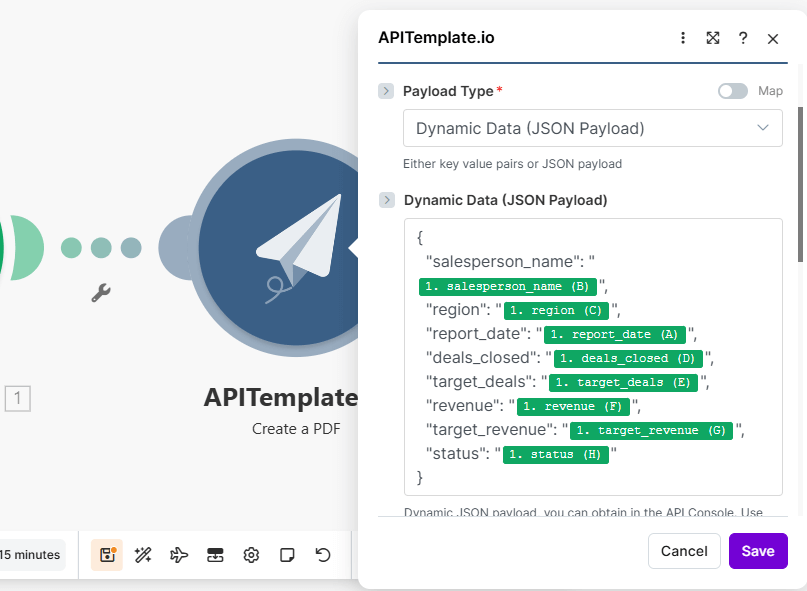
- Map your data in the Dynamic Data field:
Map each template variable to the corresponding Google Sheets column. The numbers (like 1.revenue) refer to the module number.
- Click Save to save the module
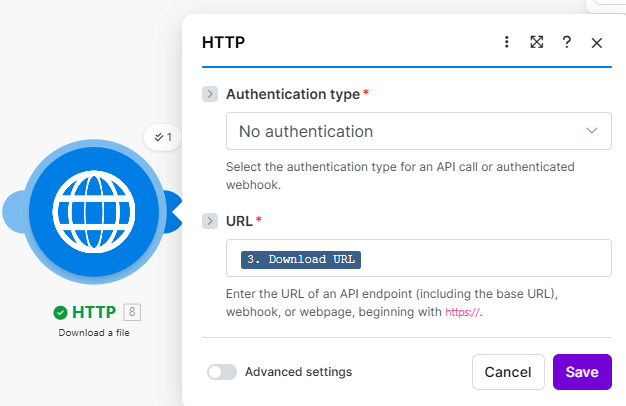
Step 7.4: Add HTTP Module to Download the PDF
The APITemplate module returns a download URL, not the actual file. Therefore, we need an HTTP module to fetch the PDF before saving it to Google Drive.
- Click the + after the APITemplate module
- Search for HTTP and select HTTP – Download a File
- Configure it:
| Field | Value |
|---|---|
| Authentication type | No authentication |
| URL | Click Download URL from APITemplate in the left panel |
- Click Save
Configure the HTTP module with Auth type, URL, etc.
Step 7.5: Save Output to Google Drive
- Click + -> Search Google Drive -> Select Upload a File
- Connect your Google account
⚠️ Gmail Users: If you see “restricted scopes” error, you need a custom OAuth client. Go to Google Cloud Console -> Create project -> Enable Google Drive API -> Create OAuth credentials -> Add redirect URIs for Make.com -> Use Client ID/Secret in Make.com’s advanced settings.
Completing the Google Drive Module Setup
After completing the OAuth setup, continue with the Google Drive module configuration.
First, create a folder in Google Drive:
- Open Google Drive
- Click New -> New folder
- Name it something like “Weekly Reports Output”.
- Click Create
This folder will store all your generated PDF reports.
Then, configure the Google Drive module:
- Connect using your custom OAuth client (follow Step E above if needed)
- Next, configure the upload:
| Field | Value |
|---|---|
| Connection | Your Google Restricted connection |
| Enter a Folder ID | Select from the list |
| New Drive Location | My Drive |
| New Folder Location | Select the folder you created (e.g., “Weekly Reports Output”) |
| File | Select Map option |
| File Name | Click salesperson_name (B) from Google Sheets, then type _report.pdf |
| Data | Click Data from the HTTP module in the left panel |
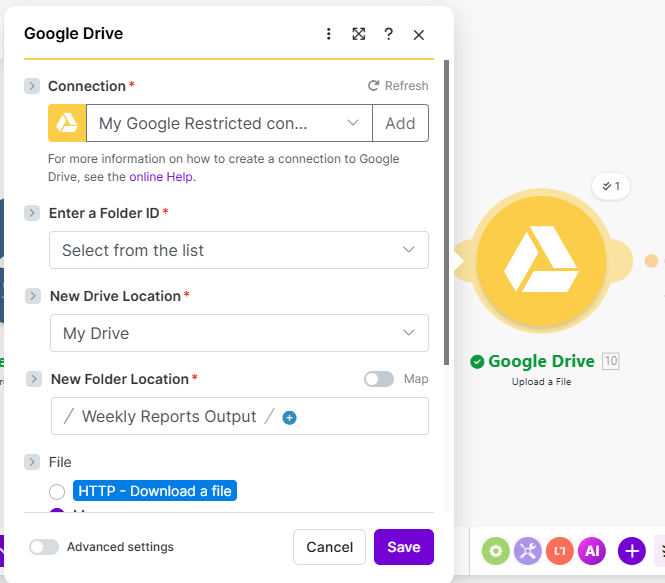
Configure the Google drive module.
Finally, build the File Name dynamically:
- First, click inside the File Name field
- From the left panel, click salesperson_name (B) under Google Sheets
- Type
_report.pdfafter it
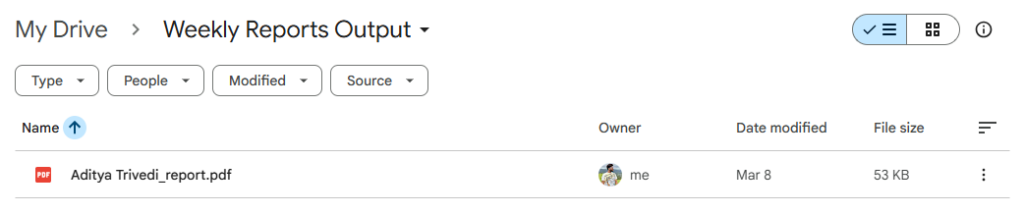
As a result, this creates filenames like Aditya Trivedi_report.pdf for each salesperson.
- Click Save to complete the module
Step 7.6: Test Your PDF API Scenario
Before activating, first test with real data:
- Add a new row to your Google Sheet with sample data
- Click Run once in Make.com (bottom left of the canvas)
- Watch the scenario execute
Green checkmarks indicate each module completed successfully. Click any module to inspect the data that flowed through it.
- Check your Google Drive folder-the PDF should be there
Your automated PDF now appears in Google Drive. Open it to verify the data populated correctly.
Step 7.7: Activate Your PDF API Workflow
Click Scheduling -> Toggle ON -> Set interval (e.g., every 15 minutes)
Choose how often Make.com checks for new rows in your spreadsheet.
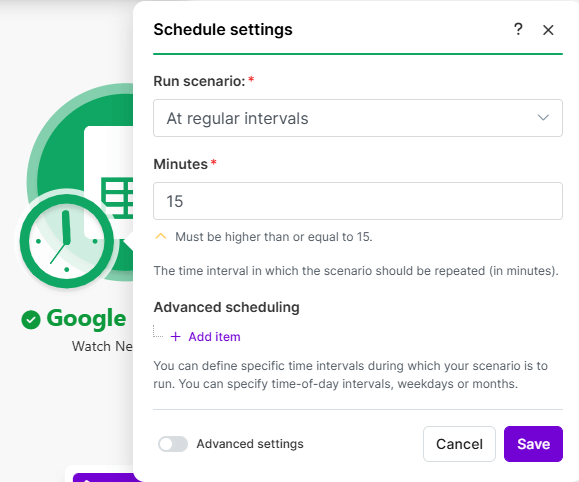
Click Save (disk icon), your automation is now live.
8. Auto-Sending PDFs via Email
Most reports need to reach someone’s inbox, not just sit in a folder. Therefore, let’s add email delivery.
Step 8.1: Add an Email Module
First, after the Google Drive upload (or instead of it, if you don’t need Drive storage):
- Add a Gmail -> Send an Email module (or use Email for non-Gmail)
- Connect your Gmail account
- Configure the email:
| Field | Value |
|---|---|
| Connection | Your Gmail connection |
| To (Recipient email address 1) | Click email (I) from Google Sheets |
| Subject | Click salesperson_name (B) then type 's Weekly Sales Report |
| Body type | Raw HTML |
| Content | See Step 8.2 below |
- Configure the attachment:
| Field | Value |
|---|---|
| Attachments | Click Add attachment |
| File | Select Map option |
| File name | Click File name from HTTP module |
| Data | Click Data from HTTP module |
- Click Save
Step 8.2: Write a Professional Email Body for Reports
Next, in the Content field, type HTML and insert variables by clicking labels from the left panel:
- Click inside the Content field
- Type your HTML, and when you need a variable, click it from the Google Sheets section in the left panel
Example email body:
Type this, clicking the highlighted variables from the left panel:
<p>Hi [click salesperson_name (B)],</p>

<p>Please find attached your weekly sales performance report for the week ending [click report_date (A)].</p>

<p><strong>Quick Summary:</strong></p>
<ul>
  <li>Deals Closed: [click deals_closed (D)]</li>
  <li>Revenue Generated: $[click revenue (F)]</li>
  <li>Status: [click status (H)]</li>
</ul>

<p>The full detailed report is attached as a PDF.</p>

<p>Best regards,<br>
Sales Operations<br>
<em>This is an automated message</em></p>
How to insert variables:
- Type the static text normally (e.g.,
<p>Hi) - Click the variable from the left panel (e.g., salesperson_name (B))
- Continue typing the rest (e.g.,
,</p>)
The variables will appear as colored chips in the Content field.
Now run the automation again and check the recipient email inbox.
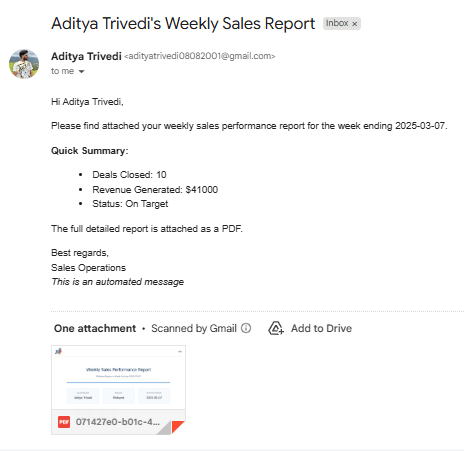
Recipient email inbox received the mail showing proper details including pdf report.
9. Troubleshooting Issues
Even well-designed automations can hit snags. Therefore, below is how to diagnose and fix the most common problems.
| Problem | Cause | Solution |
|---|---|---|
| Connection lost | OAuth tokens expired | Go to Connections -> Reauthorize |
| Template not found | Wrong template ID | Copy fresh ID from APITemplate. |
| Missing data in PDF | Variable name mismatch | Ensure exact case-sensitive match |
| No PDFs created | No new data or filter blocking | Check execution history, verify new rows exist |
| Duplicate PDFs | No deduplication | Add “Processed” column, filter for empty |
10. Alternatives: Zapier, n8n, Direct PDF Generation API
| Platform | Best For | Pricing |
|---|---|---|
| Make.com | Visual automations with logic | Free + $9/mo |
| Zapier | Simple linear workflows | Free + $19.99/mo |
| n8n | Self-hosted, privacy-focused | Free (self-hosted) |
| Direct API | Developers, custom apps | API costs only |
APITemplate integrates natively with all these platforms and is considered one of the top PDF generation APIs. For a detailed Make.com guide, see How to Generate PDFs in Make.com with APITemplate.
11. Scaling Your Workflow
Expand your automation:
- More templates: Sales reports, invoices, project updates, different brands
- More triggers: Form submissions, CRM updates, e-commerce orders
- Error handling: Add Slack/email alerts for failures
- Batch processing: For high volume, use scheduled runs instead of instant triggers
12. Summary
In conclusion, automating PDF reports from Google Sheets eliminates the tedious, error-prone work of manual document creation. With Make.com orchestrating the workflow and the PDF generation API handling document creation, you can turn any spreadsheet data into professional documents-automatically.
What we covered:
- Why automation saves time and reduces errors
- Which report types benefit most from this approach
- How Google Sheets, Make.com, HTTP, APITemplate, and Google Drive work together
- Step-by-step template creation in APITemplate
- Building the complete automation in Make.com
- Advanced feature: Email delivery
- Troubleshooting common issues
- Alternative tools for different needs
Your next action: Create your first template in APITemplate using the code provided in Section 6, then connect it to Make.com following Section 7. Most people have their first automated PDF generating within an hour.
Additional Resources
- APITemplate API Reference – Full API reference and template guides
- APITemplate FAQs – Common questions and integrations
- Make.com Help Center – Tutorials and module documentation
- Jinja2 Template Designer Documentation – Advanced templating syntax
Further reading:
Ready to Automate Your PDF Reports?
Stop wasting hours on manual report creation. Start generating professional PDFs from your Google Sheets data in minutes.
Sign Up for APITemplate – Free – Create up to 50 PDFs per month at no cost.
This guide was created to help businesses automate their document workflows. If you have questions or want to share what you’ve built, reach out to the APITemplate team.
FAQ
1. Can I generate PDFs from Google Sheets for free?
Yes. The stack described in this guide runs entirely on free tiers. APITemplate’s free plan covers 50 PDFs per month, Make.com’s free plan gives you 1,000 operations per month, and both Google Sheets and Google Drive are free with a Google account. For most small teams running weekly reports, that’s enough to run the entire workflow at zero cost. If your volume grows, APITemplate’s paid plans start at $29/month.
2. How long does it take to set up automated PDF reports from Google Sheets?
The initial setup takes 30–45 minutes if you follow this guide from start to finish. That includes creating your PDF template in APITemplate, building the Make.com scenario, and testing it end-to-end with real data. Once it’s live, the automation runs on its own – you don’t touch it again unless your template changes.
3. Do I need coding skills to automate PDF generation with Make.com?
No. This is a completely no-code workflow. Make.com uses a visual drag-and-drop canvas, and APITemplate’s template editor supports both a WYSIWYG interface and HTML/CSS if you want more control. The only technical requirement is copy-pasting an API key and mapping column names to template variables – both covered step by step in this guide.
4. What’s the difference between Make.com’s “Watch Rows” trigger and a scheduled trigger for PDF generation?
“Watch Rows” fires every time a new row is detected in your Google Sheet – ideal for real-time use cases like order confirmations, form submissions, or lead notifications where you need the PDF generated immediately. A scheduled trigger runs at fixed intervals (every 15 minutes, hourly, daily) and batch-processes all new rows since the last run – better for weekly sales reports or monthly client summaries where timing isn’t critical. For most reporting workflows, scheduled is the cleaner choice.
5. What happens if Make.com generates duplicate PDFs for the same row?
This is a common issue when the scenario runs on a schedule. The fix is to add a “Processed” column to your Google Sheet and update it to “Yes” after each row is handled. Add a filter in Make.com that only processes rows where this column is empty. That way, each row is picked up exactly once regardless of how many times the scenario runs.
6. How is APITemplate different from just exporting a Google Sheet as a PDF natively?
Google Sheets’ native PDF export converts the spreadsheet grid itself – you get rows, columns, and whatever formatting you’ve applied inside the sheet. APITemplate lets you design a proper branded document – with logos, colour schemes, tables, conditional formatting, and dynamic data – completely separate from how the data looks in the spreadsheet. The result is a client-ready PDF, not a spreadsheet printout. It also happens automatically without anyone manually clicking File → Download.
Other Blog Articles
How to Create a PDF from HTML in Zapier Using APITemplate
This guide shows you how to convert HTML to PDF using Zapier and APITemplate. You write your HTML, insert dynamic fields from your trigger app, and get a download ready PDF back, no coding required.
How to Create a PDF with Zapier and APITemplate.io
Create PDFs automatically with Zapier and APITemplate.io. Learn how to build a no-code workflow using templates and dynamic data.

How to Generate PDFs Automatically with Google Docs and Zapier
Learn how to generate PDFs automatically with Google Docs and Zapier, where this setup works best, where it gets messy, and when APITemplate is a better fit.